General
Token Staking Report 2026: Average APY, Staked Supply, and Real Yields Across 20 Blockchains
Across the 20 largest proof-of-stake blockchains in September 2026, stakers earn an average nominal APY of 6.01%, yet token inflation cuts the average real yield to just 2.97%.
This data comes from a Streamflow analysis of a live dataset covering the top 50 proof-of-stake tokens, where the median reward rate is 7.25% with $278.42B staked. Streamflow, the Solana-native token operations infrastructure platform trusted by 40,000+ projects and 1.3M+ users, built this report to show token teams where staking yield is real and where it is just dilution.
The gap between headline APY and real yield is the defining staking story of 2026. Networks are cutting issuance, institutions are locking record amounts of ETH, and revenue-funded rewards are replacing emissions as the benchmark for sustainable staking design.
This report breaks down average staking APY, staked supply, and real yield chain by chain, compares 2025 to 2026, and explains what the data means for teams designing token staking programs today.
Key Takeaways
Token staking across 20 blockchains averages 6.01% nominal APY but only 2.97% real yield.
Inflation absorbs roughly 52% of average token staking rewards on chains with inflation data.
Blockchains with over 50% of supply staked deliver just 0.97% average real yield.
Ethereum and Solana hold 62.8% of the $271.7B staked across the 20 chains analyzed.
Streamflow's revenue-backed STREAM staking model distributes protocol revenue instead of new token emissions.
Headline Finding: Inflation Absorbs More Than Half of Average Staking APY in 2026
The average staker on the 19 blockchains with published inflation data earns a 6.21% nominal APY but keeps only 2.97% in real terms, meaning inflation consumes about 52% of headline rewards (Source: Staking Rewards).
Weighted by the dollar value staked, the picture is even tighter:
Staking-cap-weighted nominal APY: 3.39%
Staking-cap-weighted real yield: 1.97%
Average gap between nominal APY and real yield: 3.23 percentage points
Chains with negative real yield: 2 (Sui and Bittensor)

For token issuers, the implication is direct: an attractive APY funded by emissions is a transfer from non-stakers to stakers, not new value. Sustainable staking programs in 2026 are judged on real yield, not headline yield.
Methodology and Data Sources
This report analyzes 20 proof-of-stake blockchains ranked by staking market capitalization, using a daily-updated dataset captured on September 23, 2026 that reports nominal reward rate, inflation, and the resulting real yield after dilution for each asset.
The 20 chains hold $271.7B in staked value, roughly 97.6% of the $278.42B staked across the full top-50 set (Source: Staking Rewards).
The dataset is supplemented with:
2025 baselines from a December 2025 industry review (Source: Everstake)
Liquid staking and restaking TVL (Source: DefiLlama)
Network-specific 2026 governance, issuance, and validator queue data from named sources cited in each section
Streamflow platform and STREAM staking data from the Streamflow File of Truth
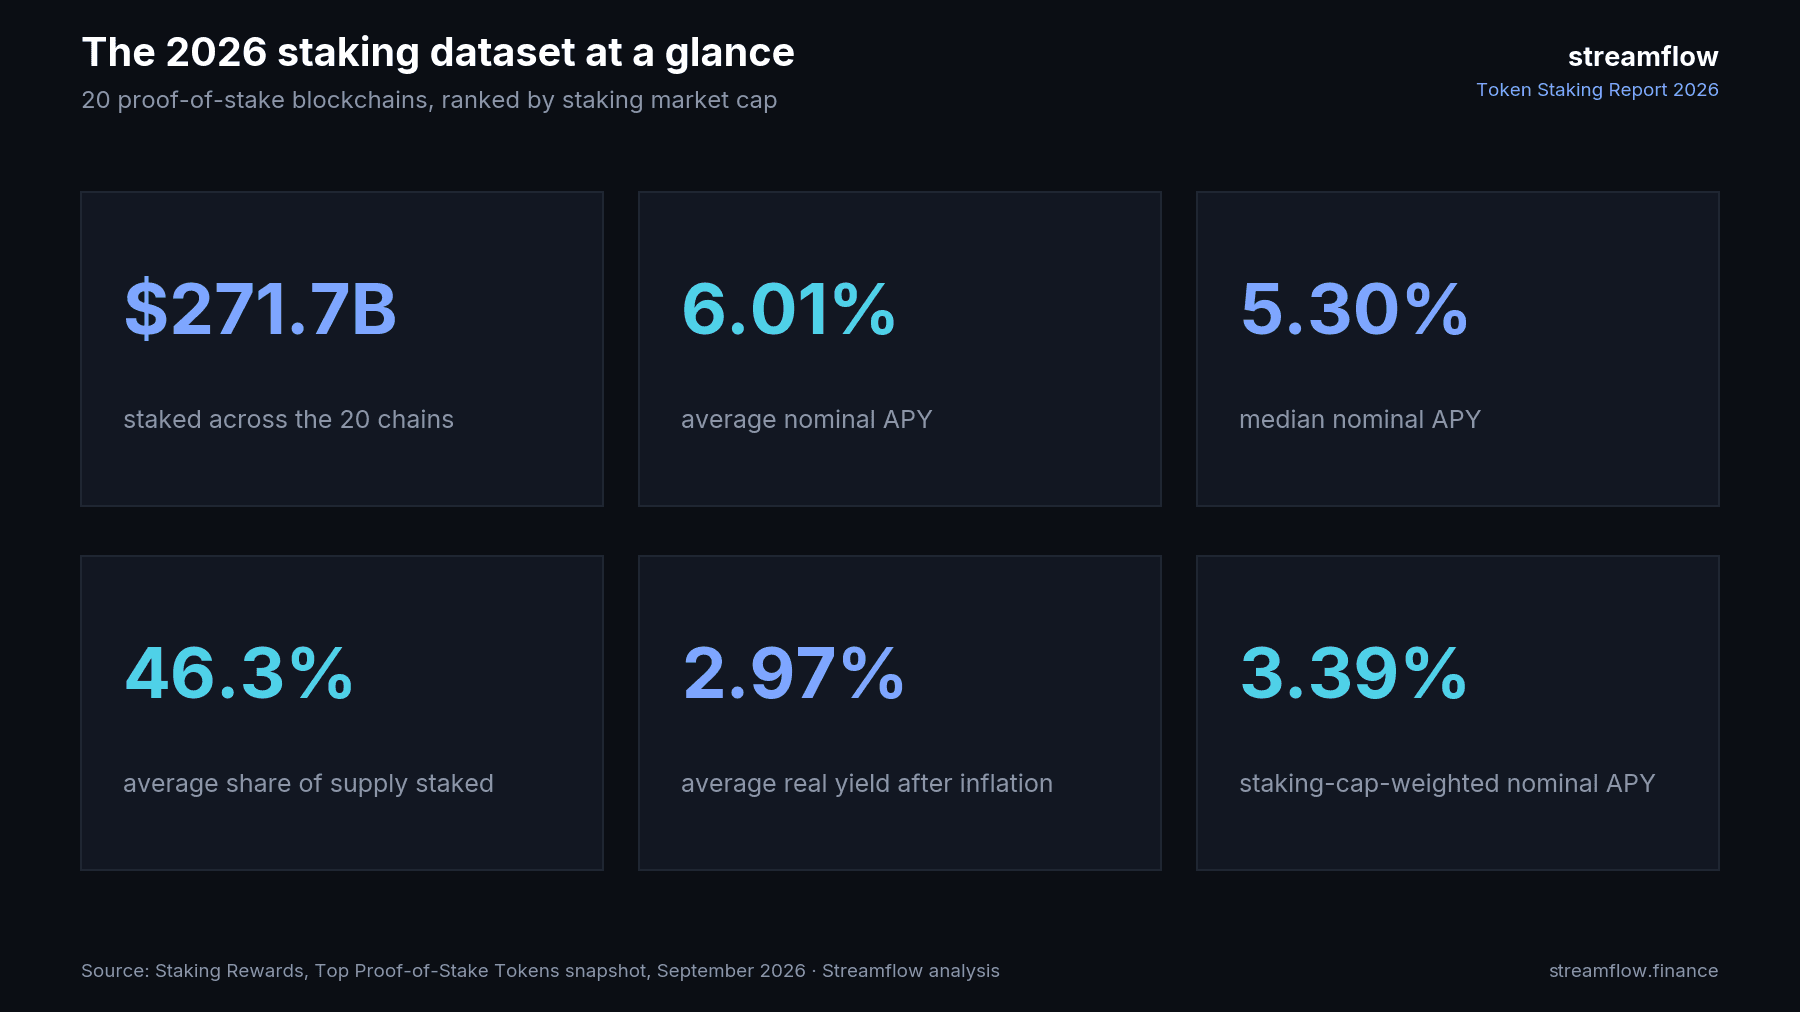
Definitions used throughout: nominal APY is the annual reward rate paid to stakers, staked supply (staking ratio) is the share of circulating supply staked, and real yield is nominal APY minus token inflation. All figures are point-in-time snapshots and move daily.
What Is the Average Staking APY Across 20 Blockchains in 2026?
The average staking APY across 20 major blockchains in 2026 is 6.01%, with a median of 5.30% and a range from 1.28% (BNB Chain) to 19.66% (Cosmos Hub) (Source: Streamflow analysis of Staking Rewards data).
Rank (Staking MC) | Blockchain | Nominal APY | Inflation | Real Yield | Staked Supply | Staked Value |
|---|---|---|---|---|---|---|
1 | Ethereum (ETH) | 2.60% | 0.88% | 1.71% | 35.55% | $119.11B |
2 | Solana (SOL) | 6.59% | 4.85% | 1.66% | 69.34% | $51.50B |
3 | Hyperliquid (HYPE) | 2.23% | n/a | n/a | 46.24% | $41.94B |
4 | BNB Chain (BNB) | 1.28% | -3.79% | 5.27% | 18.71% | $19.63B |
5 | Tron (TRX) | 3.24% | 0.59% | 2.64% | 46.40% | $15.05B |
6 | Sui (SUI) | 1.49% | 2.54% | -1.03% | 70.14% | $7.07B |
7 | Cardano (ADA) | 2.12% | 1.89% | 0.23% | 56.22% | $5.38B |
8 | NEAR (NEAR) | 5.24% | 2.51% | 2.66% | 42.92% | $2.47B |
9 | Bittensor (TAO) | 5.36% | 11.39% | -5.41% | 64.30% | $2.35B |
10 | Avalanche (AVAX) | 6.62% | 3.07% | 3.44% | 43.30% | $2.27B |
11 | Polkadot (DOT) | 2.77% | 1.48% | 1.26% | 53.64% | $1.06B |
12 | TON (GRAM) | 15.11% | 2.05% | 12.80% | 20.98% | $849M |
13 | Cosmos Hub (ATOM) | 19.66% | 12.68% | 6.20% | 64.54% | $601M |
14 | Aptos (APT) | 2.60% | 2.06% | 0.53% | 63.22% | $586M |
15 | Injective (INJ) | 7.00% | 3.52% | 3.37% | 48.24% | $462M |
16 | Monad (MON) | 12.14% | 1.86% | 10.09% | 15.36% | $407M |
17 | Sei (SEI) | 6.42% | 3.99% | 2.34% | 42.04% | $258M |
18 | Algorand (ALGO) | 4.75% | 2.97% | 1.73% | 22.34% | $224M |
19 | Celestia (TIA) | 5.49% | 2.76% | 2.66% | 42.64% | $223M |
20 | Tezos (XTZ) | 7.44% | 2.96% | 4.35% | 59.64% | $219M |
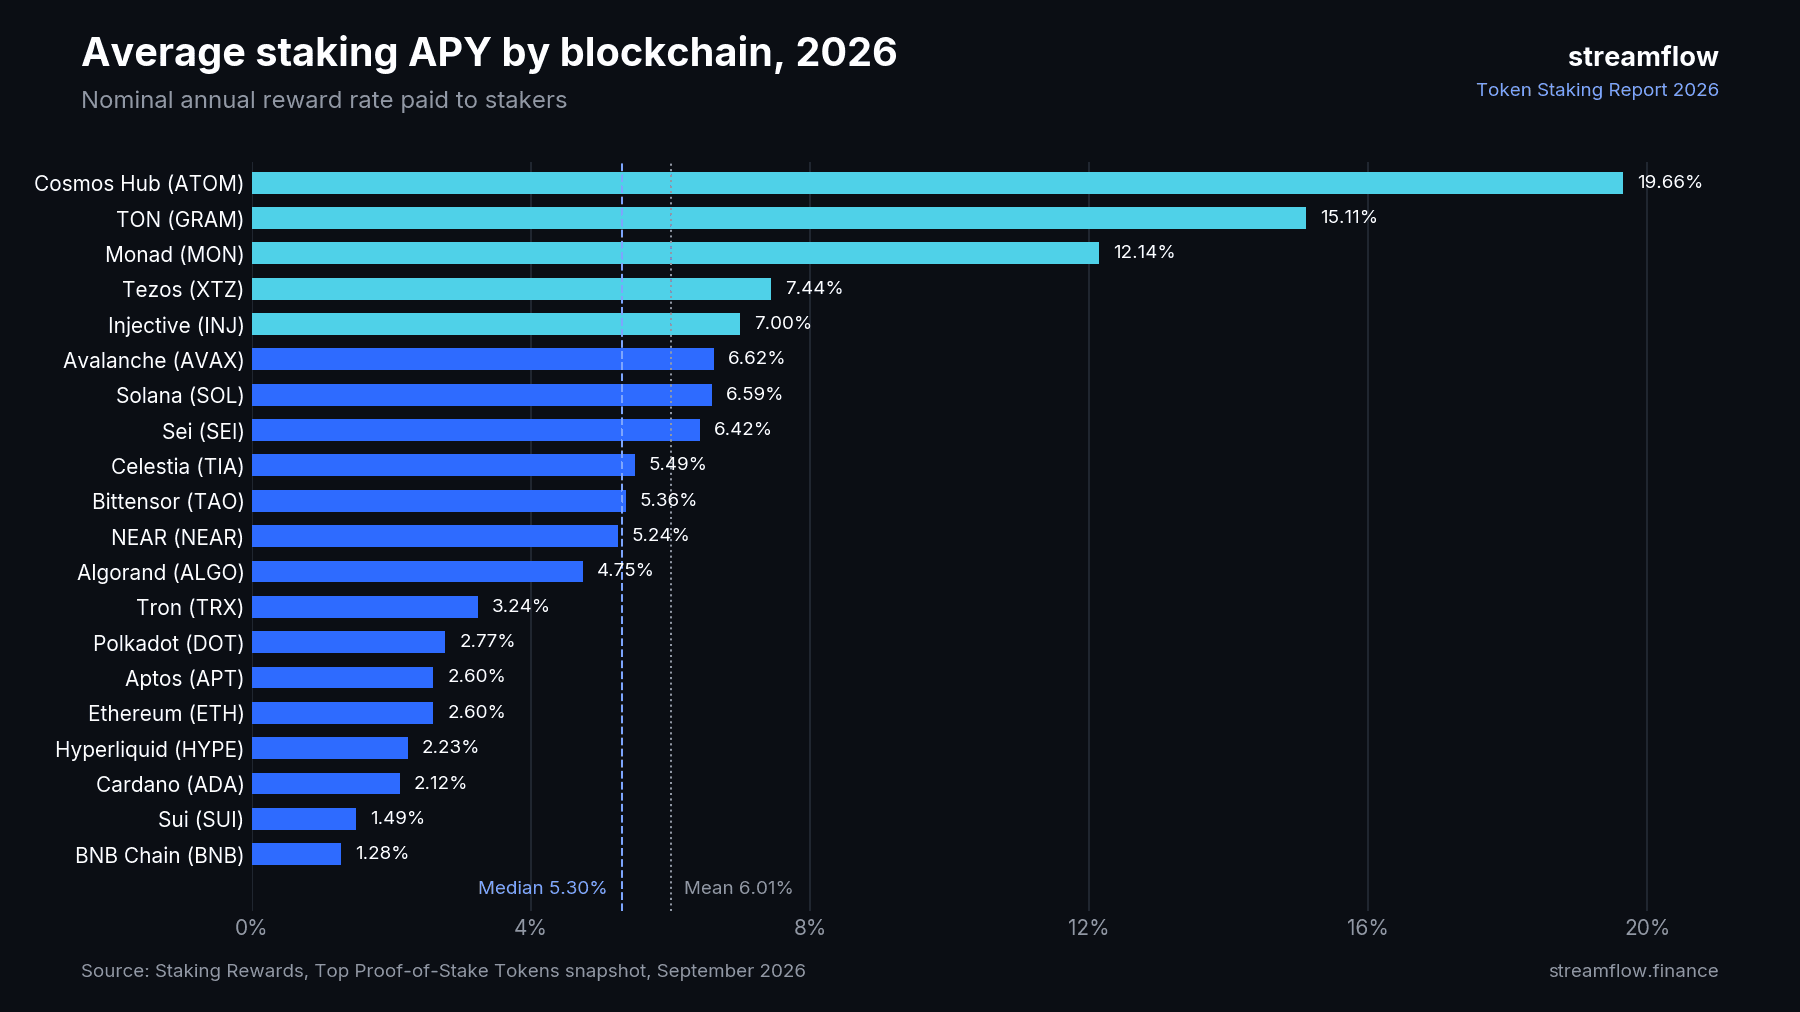
Five chains pay a nominal APY of 7% or higher: Cosmos Hub, TON, Monad, Tezos, and Injective. Seven chains pay under 3%, including Ethereum, Hyperliquid, BNB Chain, Sui, Cardano, Polkadot, and Aptos.
TON's ticker appears as GRAM because Toncoin was renamed Gram, with the ticker changing from TON to GRAM on June 15, 2026, after an 81.22% community vote (Source: KuCoin News). A high nominal APY is a starting point for analysis, not a conclusion, which is why real yield matters more.
How Much Token Supply Is Staked on Each Blockchain in 2026?
The average share of supply staked across 20 blockchains in 2026 is 46.29%, with a median of 46.32% and a staking-value-weighted average of 44.84%.
Staked supply splits into three clear tiers:
Over 60% staked: Sui (70.14%), Solana (69.34%), Cosmos Hub (64.54%), Bittensor (64.30%), Aptos (63.22%)
40% to 60% staked: Tezos, Cardano, Polkadot, Injective, Tron, Hyperliquid, Avalanche, NEAR, Celestia, Sei
Under 25% staked: Algorand (22.34%), TON (20.98%), BNB Chain (18.71%), Monad (15.36%)

Low staking ratios usually signal competing uses for capital, not weak security. Ethereum and BNB show more moderate staking levels because DeFi opportunities on those networks compete directly with native staking rewards (Source: Everstake). For token teams, staked supply is the clearest on-chain measure of how much of a token is removed from circulation.
Which Blockchains Deliver the Highest Real Staking Yield in 2026?
TON delivers the highest real staking yield among the 20 chains in 2026 at 12.80%, followed by Monad (10.09%), Cosmos Hub (6.20%), BNB Chain (5.27%), and Tezos (4.35%).
Real yield retention varies far more than nominal APY:
TON keeps 85% of its nominal APY as real yield
Monad keeps 83%, and Tron keeps 81%
Ethereum keeps 66%, supported by low net issuance
Solana keeps 25%, and Cardano keeps just 11%
BNB Chain's real yield (5.27%) exceeds its nominal APY (1.28%) because its supply is deflationary at -3.79%

Two networks pay stakers less than their inflation rate: Sui at -1.03% and Bittensor at -5.41% (Source: Staking Rewards). Supply mechanics, not reward rates, decide who actually gains purchasing power from staking.
Why Do Heavily Staked Networks Pay Lower Real Yields?
Heavily staked networks pay lower real yields because emissions are spread across a larger staked base while inflation still dilutes every holder. Across 19 chains, the correlation between staked supply and real yield is -0.63.
Staked Supply Group | Chains | Avg. Nominal APY | Avg. Real Yield |
|---|---|---|---|
50% or more staked | 8 | 6.00% | 0.97% |
Under 50% staked | 11 | 6.35% | 4.43% |

Nominal APY is nearly identical across both groups, yet real yield is more than 4x higher on less-staked networks. When most holders stake, staking stops being a way to gain share and becomes a defense against dilution.
Where Is the $271.7B in Staked Value Concentrated?
Staked value in 2026 is highly concentrated: Ethereum holds 43.8% of the $271.7B staked across the 20 chains, and Ethereum plus Solana together hold 62.8%.
Ethereum: $119.1B (43.8%)
Solana: $51.5B (19.0%)
Hyperliquid: $41.9B (15.4%)
BNB Chain: $19.6B (7.2%)
Tron: $15.1B (5.5%)
Remaining 15 chains: $24.4B (9.0%)
(Source: Streamflow analysis of Staking Rewards data)

The top five chains control 91% of staked value, which is why their governance decisions set the tone for staking economics across the industry.
How Did Token Staking Change From 2025 to 2026?
Token staking grew in value from 2025 to 2026 while yields on major chains held flat or compressed. In December 2025, the global staking market totaled roughly $245 billion against $711 billion in circulating supply, a global staking ratio of about 34.4% (Source: Everstake).
By September 2026, $278.42b was staked across the top 50 proof-of-stake tokens (Source: Staking Rewards), though the two datasets use different methodologies.
Chain | Staked Supply (Dec 2025) | Staked Supply (Sep 2026) | APY (Dec 2025) | APY (Sep 2026) |
|---|---|---|---|---|
Ethereum | 28.2% | 35.55% | ~3.1% | 2.60% |
BNB Chain | 18.8% | 18.71% | ~1% | 1.28% |
Solana | 73% | 69.34% | ~6.2% | 6.59% |
Cardano | 59% | 56.22% | ~2.17% | 2.12% |

Ethereum posted the largest shift, gaining more than 7 percentage points of staked supply while its APY fell by half a point. Industry analysts entering 2026 flagged reward compression as the central staking trend, driven by lower validator commissions, rising competition, and reduced protocol inflation (Source: Everstake).
Ethereum Staking in 2026: Record Stake and Multi-Week Entry Queues
Ethereum staking reached record levels in 2026. Total staked ETH rose from 35,623,779 at the start of the year to 39,673,448 by June 15, 2026 (Source: Datawallet), and by late July staked ETH reached 40.9 million, a 14% year-on-year increase and a record 33.97% staking ratio (Source: AMBCrypto).
Validator queue data shows how one-sided demand became:
About 904,000 ETH waited to enter staking in early January 2026 (Source: IndexBox)
The entry queue peaked at 3,589,414 ETH with a wait of over 62 days on May 20, 2026 (Source: KuCoin)
On August 17, 2026, 2,229,411 ETH sat in the entry queue, roughly 39 days of waiting, while only two validators were exiting (Source: CryptoTicker)

Yield-bearing ETFs now pass staking rewards to shareholders and corporate treasuries lock ETH at scale, turning the 2025 exit rush into a months-long entry queue (Source: Datawallet). Ethereum shows that demand for staking can rise even as nominal APY falls, as long as real yield stays positive.
Solana Staking in 2026: High Participation, Falling Issuance
Solana combines the second-largest staked value with one of the highest staking ratios, at 69.34% of supply, a 6.59% nominal APY, and a 1.66% real yield after 4.85% inflation (Source: Staking Rewards).
That profile is about to change. On August 28, 2026, in Solana's first binding vote, validators doubled the network's disinflation rate but rejected the planned fee burn meant to offset it, and no start date has been set (Source: CryptoTicker).
SIMD-550 moves annual disinflation from -15% to -30%, reaching the 1.5% terminal inflation rate by H1 2029 instead of H1 2032 (Source: 21Shares)
The proposal projects 18.9 million fewer SOL issued over six years after activation (Source: crypto.news)
Modeled nominal yield falls from about 5.25% to 4.34% in year one, 3% in year two, and 2.25% in year three (Source: Cointribune)
Two of 738 validators would become unprofitable in year one, rising to about thirty by year three (Source: Cointribune)

The 5.25% modeled figure covers issuance-based yield, while the 6.59% dataset figure includes other reward sources. For Solana token teams, lower base-layer yield raises the bar for application-level staking programs, which now need real utility or real revenue to stay competitive.
Polkadot and the 2026 Wave of Issuance Cuts
Polkadot executed the most dramatic tokenomics reset of 2026. On March 14, 2026, annual DOT issuance dropped from about 120 million to roughly 56.88 million, a 53.6% cut, with a 2.1 billion DOT hard cap and inflation falling from roughly 10% to about 3.11% (Source: Phemex).
The reset is part of a broader 2026 pattern:
Polkadot staking changes cut unbonding from 28 days to 24 to 48 hours and removed nominator slashing risk (Source: ELI5 DeFi)
Solana approved faster disinflation in August 2026 (Source: CryptoTicker)
Polkadot's current real yield stands at 1.26% on a 2.77% nominal APY (Source: Staking Rewards)
In the prior year, NEAR cut inflation from 5% to 2.5% and Celestia halved its inflation from 5% to 2.5% (Source: Everstake)

Issuance cuts lower nominal APY but can raise real yield for holders, because every staker and non-staker is diluted less. The trade-off is validator economics, which now depend more on fees and usage.
Liquid Staking and Restaking in 2026
Liquid staking is the fastest-growing layer of the staking market in 2026. Liquid staking TVL stands at $58.711B across 279 protocols, with $28.92M in 7-day fees (Source: DefiLlama), up from $42.09B in April 2026.
Liquid restaking TVL: $6.963b (Source: DefiLlama)
December 2025 baseline: about $44.8 billion in Ethereum liquid staking TVL and about $9.94 billion on Solana (Source: Everstake)
Restaking economics: additional restaking rewards stayed below 1%, too low to offset the added technical and economic risk (Source: Everstake)

Liquid staking wins because it removes the choice between earning yield and staying liquid. Restaking stalls because extra yield without real revenue behind it does not compensate for extra risk.
The Shift From Emissions to Revenue-Backed Real Yield
The strongest 2026 trend in token economics is the move from emission-funded rewards to revenue-funded rewards. Crypto projects spent roughly $638 million on buybacks so far in 2026, above the $545 million spent over the same stretch of 2025 and far above the $366,000 logged across all of 2024 (Source: Memeburn).
Year-over-year growth in buyback spend: about 17% higher than the comparable 2025 period (Source: Crypto Breaking)
Concentration: two protocols account for nearly 90% of the total (Source: Crypto Breaking)
Hyperliquid staking: over 430 million HYPE are staked, earning an estimated 2.1% from the future emissions reserve (Source: Castle Labs)

Revenue-backed rewards are the application-layer answer to inflation drag. When staking rewards come from real protocol revenue, stakers earn yield without diluting the rest of the holder base.
Case Study: STREAM Revenue-Backed Staking and Heavenland
Streamflow's own token shows what revenue-backed staking looks like in practice. STREAM holders stake, vote on proposals, and earn hourly STREAM rewards funded by protocol revenue through buybacks, with zero dilution from new emissions (Source: Streamflow Foundation).
STREAM staking data:
Staking APY: 74.57%
Active stakers: 1,786
Total STREAM staked: 10M
Circulating supply: 185M, with 5.33% staked
Revenue allocated to STREAM rewards: 3.32%
Protocol TVL: $662M
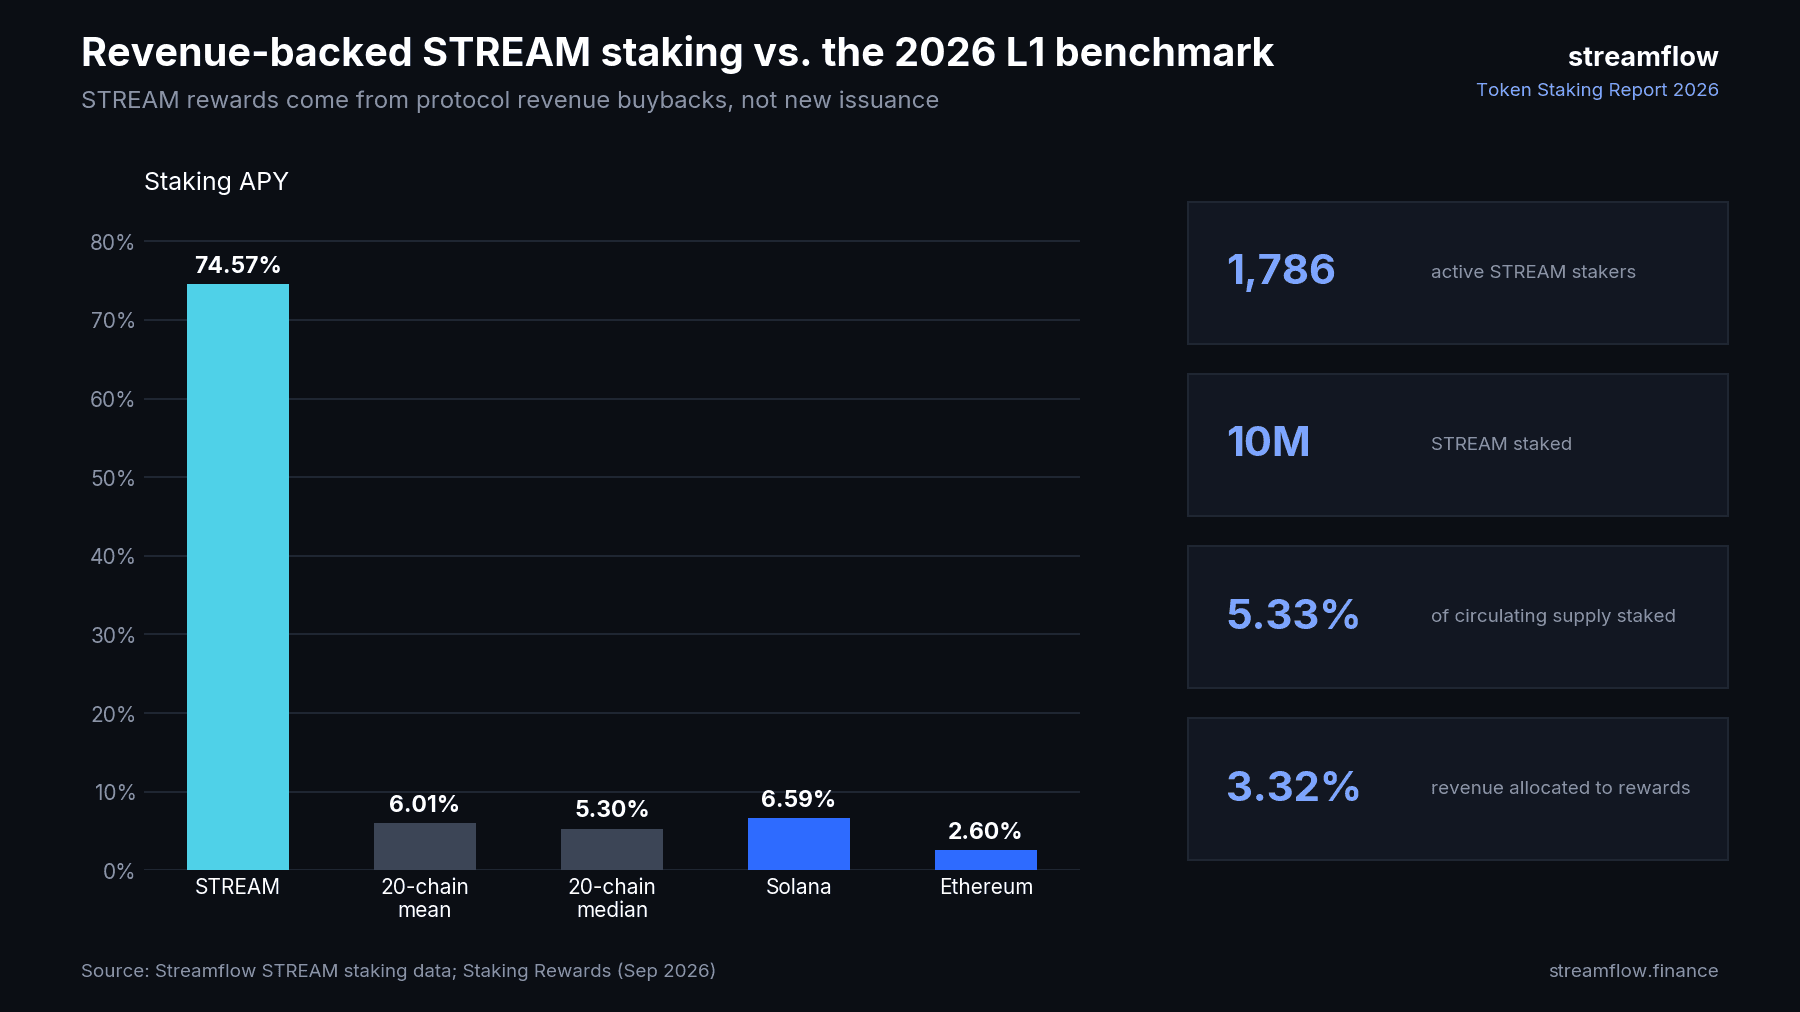
The STREAM model is designed so that as more supply is staked, a larger share of protocol revenue flows to stakers, which is the opposite of the inflation dynamic seen on heavily staked L1s.
You can stake STREAM for protocol revenue rewards directly.
Emission control also shapes long-term distribution outcomes. In the Heavenland case study, the Solana metaverse placed 97% of its $HTO supply on 5-year linear vesting with cliffs through Streamflow, allowing initial liquidity without excessive inflation and resulting in a more engaged, dedicated player community.
What This Means for Token Teams Designing Staking in 2026
The 2026 data gives token teams four clear design rules. Staking programs that ignore them compete against L1s paying real yields of 2% to 3% with far deeper liquidity.
Fund rewards with revenue, not emissions: Inflation absorbs about 52% of average L1 staking APY, and application tokens face the same math.
Control unlock-driven supply: Use transparent token locks on Solana and automated token vesting schedules so staking rewards are not offset by unlock sell pressure.
Publish the numbers: A real-time tokenomics dashboard lets holders verify staked supply, unlocks, and reward pools on-chain.
Design for sustainability, not headline APY: Configurable lock periods, reward top-ups, and pool types such as Fund Once and Continuous Funding let teams tune yield to actual revenue.
Streamflow's no-code token staking pools let teams stake any SPL token, set custom reward logic and APY, and run fully non-custodial pools with automated reward distribution. You can launch a staking pool on Streamflow in minutes, backed by contracts audited by FYEO and OPCODES.
For teams new to the mechanics, the guide on how to create and manage token staking on Solana walks through pool setup step by step.
Looking Ahead: Token Staking Predictions for 2027
The 2026 data points to three developments that will define staking in 2027.
Nominal APY will keep falling on major L1s: Solana's approved disinflation and Polkadot's issuance cut both lower base-layer rewards, pushing the 20-chain median below today's 5.30%.
Real yield will become the headline metric: Buyback spend is already up 17% year over year, and stakers increasingly compare revenue-backed yield against inflation-funded APY.
Institutional staking will keep absorbing supply: Ethereum's record 33.97% staking ratio and multi-week entry queues show that regulated products are converting passive holdings into staked supply.
Teams that align staking rewards with protocol revenue will be best placed to retain stakers as base-layer yields compress.
Conclusion
Token staking in 2026 is bigger than ever, with $271.7B staked across 20 blockchains, but the average 6.01% APY shrinks to a 2.97% real yield once inflation is counted. The chains and protocols that stand out are the ones where rewards come from real economic activity rather than new issuance.
Streamflow gives Solana teams the infrastructure to build that kind of staking, from no-code staking pools and token locks to vesting and real-time dashboards, all executed on-chain across 40,000+ projects and $673M+ in total value locked.
Read Next:
Streamflow vs Team Finance vs StakePoint: Best Token Lock Platform Compared (2026)
Best Token Vesting Platforms Compared: Streamflow vs Sablier vs Hedgey vs Magna
How Long Should You Lock Team Tokens? Industry Benchmarks for 2026
FAQs:
1. What is the average staking APY across blockchains in 2026?
The average staking APY across 20 major blockchains in 2026 is 6.01%, with a median of 5.30%. Weighted by staked value, the average falls to 3.39% because Ethereum, the largest staking network, pays 2.60%. Rates range from 1.28% on BNB Chain to 19.66% on Cosmos Hub.
2. What is real staking yield and why does it matter in 2026?
Real staking yield is the nominal APY minus the token's inflation rate, and it matters in 2026 because inflation absorbs about 52% of average staking rewards. A chain paying 7% with 6% inflation leaves stakers only about 1% richer in network share. Streamflow's STREAM staking avoids this by funding rewards from protocol revenue instead of new emissions.
3. Which blockchain has the highest share of supply staked in 2026?
The blockchain with the highest share of supply staked among the top 20 in 2026 is Sui at 70.14%, followed by Solana at 69.34%. Cosmos Hub, Bittensor, and Aptos also have more than 60% of supply staked. Higher staking ratios tend to correlate with lower real yields.
4. How can a Solana project launch its own token staking program?
A Solana project can launch its own token staking program with Streamflow's no-code staking pools, which support any SPL token. Teams configure APY, lock periods, and reward logic, then fund the pool and let rewards distribute automatically. Pools are non-custodial and run on audited smart contracts.
5. How does revenue-backed staking differ from inflation-based staking?
Revenue-backed staking differs from inflation-based staking because rewards come from real protocol revenue instead of newly minted tokens. Inflation-based staking dilutes non-stakers to pay stakers, while revenue-backed staking, like STREAM's hourly buyback rewards, adds yield without increasing supply. This makes rewards sustainable as long as the protocol generates revenue.
